Construction Cost Index West Java 2026 and East Java: Bogor 130.33, Gresik 111.23
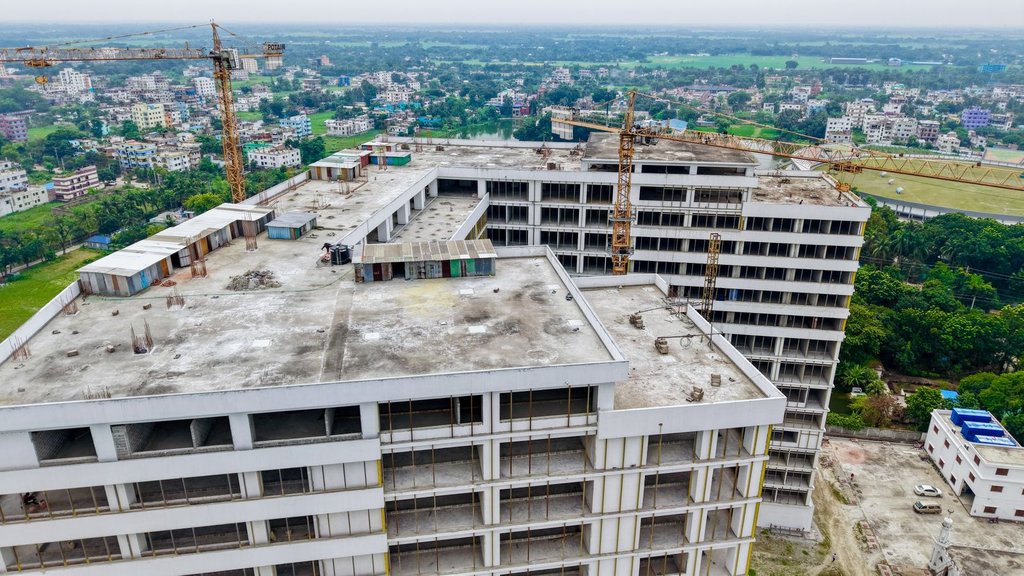
The highest construction cost index West Java 2026 is Bogor Regency (130.33), followed by Bandung City (130.26), while the highest in East Java is Gresik Regency (111.23). These figures come from the BPS Construction Cost Index 2026 publication released in early October 2026, quoted by GoodStats, with Medan as the reference city (=100). We list the top 10 regencies/cities per province as of 23 October 2026, with calculated gaps, to help budget projects in two large provinces on Java.
Construction cost index West Java 2026 and East Java 2026: top 10 regencies/cities per province
| Regency/city (rank) | Province | IKK 2026 (Medan = 100) | Gap to the East Java provincial IKK of 99.28 (homeX calculation) | Source |
|---|---|---|---|---|
| 1. Bogor Regency | West Java | 130.33 | +31.3% | GoodStats Data |
| 2. Bandung City | West Java | 130.26 | +31.2% | GoodStats Data |
| 3. Bogor City | West Java | 123.81 | +24.7% | GoodStats Data |
| 4. Bekasi City | West Java | 123.55 | +24.4% | GoodStats Data |
| 5. Cimahi City | West Java | 121.80 | +22.7% | GoodStats Data |
| 6. Bekasi Regency | West Java | 118.95 | +19.8% | GoodStats Data |
| 7. Karawang Regency | West Java | 117.78 | +18.6% | GoodStats Data |
| 8. Bandung Regency | West Java | 115.48 | +16.3% | GoodStats Data |
| 9. Depok City | West Java | 114.20 | +15.0% | GoodStats Data |
| 10. West Bandung Regency | West Java | 114.10 | +14.9% | GoodStats Data |
| 1. Gresik Regency | East Java | 111.23 | +12.0% | GoodStats Data |
| 2. Sumenep Regency | East Java | 106.85 | +7.6% | GoodStats Data |
| 3. Surabaya City | East Java | 106.45 | +7.2% | GoodStats Data |
| 4. Sidoarjo Regency | East Java | 105.51 | +6.3% | GoodStats Data |
| 5. Malang Regency | East Java | 104.82 | +5.6% | GoodStats Data |
| 6. Malang City | East Java | 104.13 | +4.9% | GoodStats Data |
| 7. Mojokerto Regency | East Java | 103.93 | +4.7% | GoodStats Data |
| 8. Pasuruan Regency | East Java | 103.68 | +4.4% | GoodStats Data |
| 9. Banyuwangi Regency | East Java | 103.44 | +4.2% | GoodStats Data |
| 10. Jombang Regency | East Java | 103.34 | +4.1% | GoodStats Data |
Source: GoodStats Data summaries of the BPS Construction Cost Index 2026 publication for West Java (17 October 2026) and East Java (18 October 2026); the East Java provincial IKK of 99.28 from the GoodStats summary; the BPS publication page for the definition and reference city. homeX calculation: Bogor Regency 130.33 versus Gresik 111.23 is about 17.17% higher; Bogor Regency versus Jombang 103.34 about 26.12%; Gresik versus Jombang about 7.63%. Data gaps: we do not have the West Java provincial IKK; ranks below the top 10; Medan itself; prior-year figures; or a machine-readable official BPS table (figures are quoted from GoodStats). The GoodStats summaries contain typos, e.g. "year 2016" for Bandung Regency and "IKIP" for Jombang; we read them as IKK 2026 and Jombang 103.34, to be checked against the BPS publication. The BPS page shows a publication date of 2 October 2026 while the page metadata says 1 October 2026. IKK is not a material price; the gap column is not official data.
Patterns across the two provinces
In West Java, the Bogor-Bekasi-Depok area, Bandung and Karawang dominate the list: Bogor Regency, Bogor City, Bekasi City, Cimahi, Bekasi Regency, Karawang and Depok. In East Java, the gaps between areas are narrower (103.34 to 111.23) and Gresik, Surabaya and Sidoarjo sit in the Surabaya industrial corridor. homeX analysis, not data: the pattern is consistent with higher construction cost in dense and industrial areas, but the source does not explain the cause.
How to use IKK for a renovation or house-building budget
IKK is an index relative to Medan, not rupiah per square metre. A safe approach: take cost per m2 from a local quote or the homeX house-building cost articles, then use the IKK ratio only to compare two locations, noting that the IKK weights cover buildings, roads and networks. Also compare with the homeX national IKK 2026 article for the 10 highest and lowest provinces.
Buyer tips
- Use IKK to compare locations, not to calculate rupiah per m2.
- Get local quotes as the budget base, then compare with IKK.
- Check quoted figures in the original BPS publication before using them in official documents.
- Watch material freight to remote areas even if the nearest city has a lower IKK.
Request a construction cost index West Java 2026 quote for your project
homeX can compare several brands at once and prepare a written quote for projects, renovations or shop stock. Send your needs (brand, size, quantity, location) via WhatsApp +62 821 1818 998, or visit the homeX showroom: Priskilla Tower, 6th floor, Jl. Atang Sanjaya No.21, Benda, Kota Tangerang, Banten 15125. Visit the homeX Showroom.
Disclaimer: prices change without notice and differ by store, city, pack size, grade and promotion. Data as of 23 October 2026; always confirm with the seller before buying.
FAQ
What is the highest IKK in West Java in 2026? Bogor Regency 130.33, followed by Bandung City 130.26 and Bogor City 123.81 (GoodStats, citing BPS).
What is the East Java IKK in 2026? The East Java provincial IKK is 99.28; the highest regency/city is Gresik at 111.23, followed by Sumenep 106.85 and Surabaya 106.45.
Is IKK the same as building material prices? No. IKK is an index relative to Medan that combines material prices, heavy equipment rental and wages; it is not the price of one material.
Construction cost index West Java 2026: related articles and products
Related articles:
- House Construction Cost per m² Indonesia 2026
- Construction Sector Growth 2026 6.68% and Inflation 3.28%: Building Materials
- Builder Daily Wages 2026: Labourer, Mason and Foreman in Jakarta and Padang
- Wall Cost per m² 2026: Red Brick vs AAC Block, How to Calculate
- Concrete Slab (Cor Dak) Cost per m² 2026: Ready Mix, Rebar, Formwork, Pump
Related products at homeX:
Price sources (checked 23 October 2026): GoodStats Data — Top 10 regencies/cities in West Java by IKK 2026 (citing BPS); GoodStats Data — Top 10 regencies/cities in East Java by IKK 2026 (citing BPS); BPS — Construction Cost Index by Province and Regency/City 2026 (released 1 Oct 2026).